Quantcast
Channel: PeakVue Archives - Emerson Automation Experts
Viewing all 57 articles
Browse latest View live

Spotting Bearing Failure in Time before Complete Fan Failure

$
0
0

In a prior post, The Peaks Provide the Early Warning in Machinery Protection, I highlighted how using high-speed, PeakVue digital sampling of machinery vibration could help spot mechanical defects long before traditional vibration monitors could.

I received a note from Craig Truempi with Emerson local business partner, Novaspect. He shared:

This fan bearing failed last week, and as you will see the red line (PeakVue) clearly identifies the fault, while the blue line (Overall Vibration) once again missed it.

This is a great example that demonstrates a perfect fit for wireless machinery monitoring using PeakVue with the CSI 9420 Wireless Vibration Transmitter.

I asked Craig and our Asset Optimization team to give me some more background to share with you. They noted:

Not all vibration and preventive maintenance can be solved by using a route-based CSI 2130 Machinery Health Analyzer and specifically with overall vibration monitoring. In this case, the process manufacturer was using a CSI 9420 to provide continuous monitoring of the fan. With the early warning provided by PeakVue measurements, they were able to shut down the fan prior to complete failure. When the fan was being repaired, the bearings were inspected and it was clear to see the bearings had failed.

Without PeakVue and the CSI 9420, this bearing defect could have continued to deteriorate and ultimately lead to a more costly failure and extended downtime.

The advancement of technology through high-speed digital sampling has improved everything from the movies and music we enjoy to the early warning provided to maintenance teams in manufacturing plants.

MP3 | iTunes

Download audio file (Spotting-Bearing-Failure-in-Time-before-Complete-Fan-Failure.mp3)

Related Posts:


Vibration Monitoring Improves Wind Turbine Availability

$
0
0

Rotating machinery including wind turbines are subject to wear and tear over time. Emerson’s Douglas Morris, a member of the alternative energy team, shares how vibration-monitoring equipment can help avoid unplanned downtime and costly maintenance.

Emerson's Douglas MorrisThe United States’ Upper Midwest boasts some of the richest wind resources in North America and is home to some very large wind generation farms. Avoiding unnecessary and costly maintenance repairs is important to local utilities as they rely on wind as a key part of their generation portfolios.

I became aware of a slick solution by an Emerson business partner, Craig Truempi of Novaspect, who deployed wireless vibration technology on a select set of wind turbines. These wireless vibration transmitters can detect impending bearing, lubrication, and gearbox problems before they fail.

Currently, the monitoring solution includes Emerson’s wireless vibration monitors, a HART wireless mesh network, and a cellular link for remote data collection. Initial data analysis using PEAKVUE technology has proven successful in identifying a bad bearing on one of the generators. Early detection of these problems allows repairs to be carried out on the tower, resulting in an estimated repair savings of $245,000.

By detecting these issues early, planners can schedule a $5,000 bearing replacement on the tower and avoid having to perform a complete replacement of a gearbox or generator. Removal and replacement of a gearbox or generator can total $250,000 due to fact that the repair work takes place at 250 feet or more in the air.

Without these real-time analytics, small problems often go unnoticed until they manifest themselves as large problems. In the case of wind turbines, such large problems typically result in a fifty-fold increase in repair costs. Additionally, such problems can keep a unit offline for extended periods while major parts are secured, cranes are scheduled, and repair workers are mobilized.

Wireless vibration measurements on wind turbines

Click to enlarge


Diagnosis of wind turbine bearing failure

Click to enlarge

Related Posts:

ISA Automation Week-Monitoring Essential Assets

$
0
0

ISA Automation Week is happening this week in Orlando, Florida. If you’re there, you may want to see Emerson’s Nikki Bishop‘s presentation, Essential Asset Monitoring: The Gateway to Improved Process Reliability. She’ll be presenting on Wednesday at 3:15 to 4:45pm in the Asset Performance 1 track. Here’s the abstract from the presentation:

Traditionally, process plants were built with the minimum amount of instrumentation, only the most expensive assets warranted monitoring and protection systems. However, many of these unmonitored assets are still essential to safe and profitable operation. These second-tier assets (pumps, blowers, small compressors, air cooled exchangers, etc.) are typically monitored with spot-checks done manually in the field, or by preventive maintenance. Today, there are economically feasible solutions to monitor these essential assets. This presentation will focus on wireless instruments and asset-monitoring algorithms, and how the combination of the two serves as a gateway to overall improvements in plant reliability, allowing operations to take advantage of market conditions to maximize profitability.

I received a sneak preview of Nikki’s presentation and wanted to highlight a few elements from it. A key reason for the need to monitor essential assets is that unexpected circumstances in an operating plant can quickly lead to catastrophic events. Improvements in process equipment reliability reduce the risk and occurrence of these events. Increased monitoring of process equipment can provide confidence that the equipment is available for continuous operation without the added costs of reactive (run to failure) and preventive maintenance strategies.

She defines reliability as the ability of a system to perform and maintain its functions in routine circumstances, as well as in hostile or unexpected circumstances. Essential assets such as simple compressors, pumps, fans, and process vessels typically do not have wired monitoring systems like the more critical assets such as turbine generators, turbine centrifugal compressors, etc. However, their failure may lead to significant process disturbance, slowdown or shutdown.

Click to enlarge

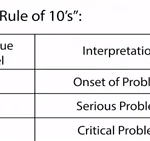
Nikki shows a 9 square grid showing probability of failure (low, medium, high) versus impact of failure (low, medium, high). Critical assets are in the box where both probability and impact are high. Essential assets fall into the boxes where impact is high, and where impact is medium and probability is medium or high.

These essential assets are both sources of unplanned downtime and higher maintenance costs. How maintenance strategies deal with these assets range from run to failure to preventive programs, to predictive monitoring and maintenance, to fully automated monitoring. Nikki cites a 2010 NPRA presentation, BP Texas City Reliability Accelerator Effort, which concluded that reactive maintenance costs are 50% higher than planned maintenance costs.

Automated monitoring helps detect process conditions that may be inducing a fault of equipment providing time to avoid the abnormal condition. It provides advance warning of asset health degradation to allow spare switchover. It helps accurately determine when service is necessary to avoid unnecessary servicing and run-to-failure conditions. And, it brings asset monitoring visibility to the control room operators and eliminates unnecessary trips to the field, in potentially hazardous areas.

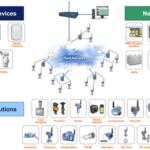
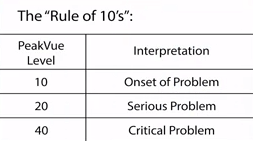
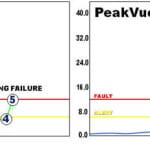
As we’ve highlighted in earlier posts, wireless monitoring instrumentation can be used for difficult to install locations. Nikki also included discussions around the types of data that can be collected wirelessly, types of common pump faults, PeakVue diagnostics, impacts of pump failure, and ROI calculations based on operational and maintenance savings.

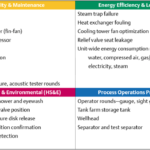
She closes by summarizing assets that are candidates for monitoring including ones with repeat failures, ones without spares, ones located in hazardous areas, ones that may cause a fire/environmental incident, or ones that can lead to a process shutdown or slowdown.

Hopefully, you’ll get a chance to see Nikki’s presentation this week or at the American Fuel and Petrochemical Manufacturers Q&A and Technology Forum next week. If not, there’s always the Emerson Exchange conference in Anaheim the following week to connect!

MP3 | iTunes

Download audio file (ISA-Automation-Week-Monitoring-Essential-Assets.mp3)

Related Posts:

How Technology Can Help Miners Improve Brownfield Operations

$
0
0

As miners face many economic and technical headwinds, Emerson’s Douglas Morris of the metals and mining and power industry teams, describes how technology can improve mine productivity by reducing unplanned downtime.

Emerson's Douglas MorrisIf you’ve picked up the newspaper recently, you’ve likely read about several stated changes in investment strategies for mining companies. In the Wall Street Journal, BHP Billiton’s CEO talks about the companies renewed focus: “The prime drive is to get everyone working along the axis of productivity, running our operations more effectively, to increase margins and returns even in the absence of strong prices”. On May 3rd, the first day of trading for the newly formed Glencore Xstrata, CEO Ivan Glassberg discusses how the company “foresees more attractive returns from brownfield expansions and mergers and acquisitions than investment in greenfield projects”.

These strategies make a lot of sense as miners face headwinds: falling commodity prices, lower quality ore bodies, and an increasingly expensive and shrinking skilled labor pool. In fact, Andrew Mackenzie, BHP’s CEO states that a 1% improvement in labor productivity could result in $170 million in annual savings.

A host of items can improve mine productivity, ranging from improving recovery using Advanced Process Control to reducing the amount of unplanned equipment downtime to operating mines remotely. The thread that binds all of these initiatives is technology, which will increasingly be leaned upon to supplement the labor pool and ultimately allow miners to achieve improved margins and shareholder value.

Take for example the mine maintenance team. The most effective method for reducing unplanned downtime with regard to fixed and mobile mining assets is to establish a good condition-monitoring program, which focuses on machinery vibration. Vibration monitoring is widely accepted as one of the earliest fault detection techniques used by maintenance professionals.

Unfortunately, not all miners have access to the expertise that’s required to administer such a program so they either outsource the service or the simply don’t have one in place. One approach that is overcoming this challenge for many miners is the use of an intelligent online vibration monitoring system, such as the CSI 6500 from Emerson.

Operationally, this system features a patented-technology called PeakVue (peak value analysis), which measures intensifying levels of stress waves in addition to vibration. PeakVue provides a defect warning system that alerts you to problems long before traditional vibration analysis. On top of that, using it doesn’t require experts because the system provides you a number that tells you whether or not something is wrong. Simply put, the higher the PeakVue number, the more severe your problem. Operators can easily interpret these numbers and can get the maintenance staff involved well before any production is affected. Those miners looking to move toward zero unplanned downtime may find PeakVue Emerson’s technologies just the tool capabilities they need.
PeaKVue Machine Condition
PeakVue Equipment Condition DetectionSo where would online condition monitoring with PeakVue be applied in a mine? Here a list of some mobile and fixed asset applications: blasthole drills, electric rope shovels, draglines, mobile and fixed crushers, mills, vibrating screens, haul trucks, stackers, reclaimers, and conveyors.

We are seeing more and more miners turn to condition monitoring. Those that have are realizing improved margins. Those looking for and edge should start with establishing a similar online condition monitoring program.

Related Posts:

Portable Vibration Analyzer-Human Centered Design Style

$
0
0

You may have seen the news of a next generation of portable vibration analyzer, the CSI 2140 Machinery Health Analyzer. Portable vibration analyzers are great for providing advance warning of machinery failures as part of a predictive maintenance program. The CSI 2140 provides a significant technology improvement over the CSI 2130, long known for its fast vibration data collection capabilities.

I first became aware of this product last week when whispers were going on about it, in some of the social networks. I turned to Emerson’s Drew Mackley, to give me some more details than what’s in the press release that I could share.

Like many of the new and upgraded technologies I’ve highlighted, a human centered design (HCD) approach was taken in the development process. The news release highlights the improvements:

…new four-channel simultaneous data collection functionality, wireless and Bluetooth communication, and a full-color touchscreen. The CSI 2140 also delivers the fastest route collection capability on the market, enabling workers to spend more time on higher-value tasks.

CSI 2140 Portable Vibration Analyzer WidthDrew noted that since this is a portable unit, size and weight were key areas of focus. At 1.5″ (38mm), it’s now the thinnest vibration analyzer out there and easier to operate and hold. Also, the battery life was increased to over 10 hours between charges to be able to cover an entire shift. Other ergonomic improvements include a large 7.5″ (190.5mm) diagonal touchscreen that works even with gloves on, and a brighter screen that visible even in full sunlight. Brightness auto-adjusts just like we’ve come to expect from our smart phones.

CSI 2140 Touchscreen with GloveAs part of the HCD effort, the speed of data collection was also a focus. Having to collect data in exceedingly hot/cold/noisy/hazardous areas means the faster you can collect the data, the sooner you’re out of that area. The data collection speed has been increased by 30-60% over other available vibration analyzers.

A big advancement on the data collection side is the number of channels that can be collected, up to four-channel analysis plus phase. Drew explained that four-channels provided the ability to collect data in the x-, y- and z-axis along with a reference vibration. For those that are familiar with vibration measurement, this simplifies route collection, cross channel, transient, bump, 4-plane balancing, AC motor rotor bar, and Operating Deflection Shape (ODS)/Modal analysis.

The onboard analysis includes PeakVue early bearing and gear fault detection, autocorrelation (determines periodic or random impacting), field alarming showing severity via color, fault frequencies (to identify vibration source), parameter trending (to show fault severity and degradation rate), and analysis expert troubleshooting tests.

Technicians have this data available not just locally on the device, but remotely back at the AMS Machinery Manager via Wi-Fi. This allows a member of the team to analyze the data already collected while another team member is collecting more routes. Bluetooth is also available to connect other peripherals to the device.

I can’t cover all the other great things such as SD slots for additional memory, and comfortable carrying strap, and more in this post, so I’ll point you to the page where Drew and the team have put additional information.

It’s great to continue to see technology advancements that begin with the users and the tasks that they perform. It translates into better, more intuitive products.

MP3 | iTunes

Download audio file (Portable-Vibration-Analyzer-Human-Centered-Design-Style.mp3)

Related Posts:

Mobile Device Task-Based Procedures for Vibration Analyzers

$
0
0

CSI-2140-Mobile-Procedures-QR-codeCSI-2140-Mobile-ProcedureThe growing impact of smart phones and tablet technology continue to impact our everyday lives, including our world of process automation. I heard from some friends on Emerson’s Machinery Health Management team of a new mobile site, the CSI 2140 Mobile Procedure. It provides maintenance personnel access to instructions for common vibration analysis tasks from a mobile device.

In an earlier post, Portable Vibration Analyzer-Human Centered Design Style, I shared some improvements in this device to increase the efficiency of route-based machinery vibration collection and analysis.

For this mobile site, instead of providing the entire product manual in a mobile web-based format, a human-centered design, task-based user interface is provided.

The site lists common tasks that are typically performed. Many tasks include the prerequisite steps required to perform the task, a step-by-step procedure to follow, and the results of the task that one should expect. Other tasks provide an overview of the task followed by a step-by-step procedure.

For example, the task to collect a vibration waveform provides this overview:

A vibration waveform is a graph that shows how the vibration level changes with time. The waveform shows the vibration level at a particular time during the measurement.

The waveforms are discrete graphs represented by a series of equally-spaced, discrete sample points (connected by straight lines). The more sample points in a spectrum, the higher the resolution of the waveform and the more memory used.

Here is the step-by-step procedure:

  1. Create a job or open Analyze from a route measurement point.
  2. From the Analyze main menu, press F1 Manual Analyze > F1 Set Analyze Mode.
    Use the up and down arrow keys to select Waveform.
  3. Press Enter. The Analyze Setup screen appears.
  4. Set the following options as necessary.
    Option Description
    F2 Set Fmax Set the maximum frequency for the waveform.
    F2 Set Sample Rate Enter a value between 25.6 and 204,800 for the number of samples per second. The default is 1,024.
    F4 Set Samples Enter a value between 256 and 32,768 for the number of samples to collect. The resolution of the waveform increases with the number of samples used. The more samples, the more information the waveform contains. The default is 1,024.
    F5 Set Sample Time Enter the total time that data is collected for each waveform. The duration of a waveform is the total time information is collected from the waveform. The default is 1. Note: Enter either the sample time or the number of samples. Setting one adjusts the other automatically.
    F7 Tach Setup Set up the tachometer parameters. See Set up a tachometer.
    F8 PeakVue Demod Enable or disable PeakVue or Demodulation. See PeakVue and demodulation.
    F9 Set Trigger Select the type of trigger to use to start the measurement. See Triggers.
    F12 Input Setup Set up the input channels, the sensor type, and the units for the acquisition type.
  5. Press Enter to collect the data. One or more plots display the data.
  6. Press F9 Store Data to save the data to a route or a job, or press F8 Start to redo the measurement.

The Machinery Health team invites your feedback on this application to continue to refine and make it more valuable for maintenance professionals.

Give it a try and see what you think.

You can also connect and interact with other machinery health professionals in the Asset Optimization, Maintenance and Reliability track of the Emerson Exchange 365 community.

Related Posts:

Avoiding Bearing Failures with the Rule of Tens PeakVue Measurement Methodology

$
0
0

Few things wreck a good day at the plant, mill, platform, wellpad, or other process like a bearing failure on an important pump, compressor, fan, or other piece of rotating machinery. Identifying the problem early before it leads to an unplanned shutdown means the work to fix it can be scheduled to minimize operational impacts.

In earlier posts, such as Spotting Bearing Failure in Time before Complete Fan Failure, we highlighted the unique PeakVue (peak value analysis) methodology to detect early problems with bearings before they lead to a bad day. This diagnostic tool is useful for bearing defect detection in applications where normal spectral analysis has proven to be ineffective—large gearboxes, slow speed machinery, etc.

Through the magic of a succinct, 3-minute YouTube video, PeakVue InfoGraphic Animation, here is an overview explaining PeakVue measurements of stress waves on a typical plant asset through the stages of bearing failure.

Rule-of-10sBearings with no problems should have a PeakVue value close to 0. The video shares a simple “rule of 10′s” guideline that highlights the stages of bearing failure—onset of problems (10g’s), serious problem (20g’s), critical problem (40g’s). This progression may occur over weeks or even months, but once it advances past 40g’s, a failure is likely to be imminent.

This PeakVue measurement is available in the vibration analysis products including the CSI 2140 portable analyzer, the CSI 9420 wireless vibration transmitter, and the CSI 6500 machinery health monitor.

You can connect and interact with other reliability and machinery health professionals by joining in the Asset Optimization, Maintenance and Reliability track of the Emerson Exchange 365 community.

Related Posts:

Rotating Equipment Bearings and Potholes

$
0
0

Concerning yesterday’s post, Avoiding Bearing Failures with the Rule of Tens PeakVue Measurement Methodology, I received an email with a great analogy about pits in ball bearings and potholes.

Potholes in the road – https://en.wikipedia.org/wiki/Pothole

Driving your car on a freshly paved circular track is like a PeakVue measurement at or close to 0g on the bearings of your rotating machinery.

As a pothole begins to form and you drive over it, you hear and feel a little bump on each trip around the track. That’s like a PeakVue measurement of 10g’s indicating an early onset of problems with the pump, compressor, fan, or other piece of rotating equipment.

When the pothole has grown larger and you drive over it each time, you hear a feel a loud bump and worry that your tire is damaged and your car in need of an alignment. That’s like a PeakVue measurement of 20g’s indicating a serious problem.

When you drive over a pothole so large, that your tire bursts, the car bottoms out, and you see a trail of oil in your rear view mirror. That’s like a PeakVue measurement great than 40g’s and your plant asset is in critical condition. It may not have completely broken down, but the breakdown is imminent.

Watch out for those potholes, monitor those bearings, and take care of them early when the reading climbs up to the 10g range.

Related Posts:


What is Damaging Your Plant Machinery?

$
0
0

Ray Garvey Application Engineer

Ray Garvey
Application Engineer

“Why do some machines fail early, while others operate for many additional years?” Emerson’s Ray Garvey and Spectro‘s Pat Henning open with this great question in a Machinery Lubrication article, Identifying Root Causes of Machinery Damage with Condition Monitoring.

Machinery-Lubrication-Condition-MonitoringRay and Pat point to eight sources that can damage your plant’s machinery including:

…abrasion, corrosion, fatigue, boundary lubrication, deposition, erosion, cavitation and electrical discharge.

The good news is that condition monitoring can detect each of these life-shortening conditions to provide your maintenance team early warning to take corrective actions.

The authors note that four of these conditions, abrasion, corrosion, fatigue and boundary lubrication provide the majority root cause of plant asset failures. Abrasion:

…is usually a result of three-body cutting wear caused by dust contamination of the lubricating oil compartment. Dust, which is much harder than steel, gets trapped at a nip point between two moving surfaces. The trapped particles tend to imbed in the relatively softer metal and then cut grooves in the harder metal.

Stress waves are produced in the metal which can be detected [hyperlink added]:

…using high-frequency stress-wave analysis techniques such as Emerson’s PeakVue™ technology.

They highlight the importance of establishing lubrication cleanliness targets as outline in ASTM D7416, D7647 and D7596.

Corrosion:

…is a chemical reaction that is accelerated by temperature. The Arrhenius rate rule suggests that chemical reaction rates double with each increase in temperature of 10 degrees C.

It is best detected:

…using spectrometric oil analysis (SOA) such as rotrode (ASTM D6595).

Fatigue:

…is a consequence of subsurface cracking, which is caused by cumulative rolling contact loading of rollers, races and pitch lines of gear teeth… Eventually, the metallic hardening progresses to subsurface cracks accompanied by acoustic emissions like miniature earthquakes.

Ray and Pat share fatigue detection methods:

Acoustic emission or stress-wave analysis such as PeakVue is capable of detecting subsurface cracking that eventually produces fatigue wear. X-ray fluorescence spectroscopy (XRF) and ferrous density measurements are used to detect wear debris released into a lubricant….v

They point to the ASTM D7596 standard as a good approach for the particle analysis.

The fourth major root cause, boundary lubrication or adhesion:

…is a lubrication regime in which loads are transferred by metal-to-metal contact. For most machine designs, this is abnormal because preferred lubrication methods provide a lubricant film between load-bearing surfaces.

When the proper lubrication breaks down metal-to-metal contact occurs between the moving surfaces increasing friction levels. Condition monitoring to detect this condition include:

Contact ultrasonic measurements or high-frequency stress-wave analysis techniques such as PeakVue are capable of detecting friction produced by boundary lubrication (metal-to-metal contact). Oil-breakdown-related techniques such as viscometry, time-resolved dielectric (ASTM D7416), AN and BN are also relevant in this case.

You’ll want to read the article for a more detailed look at these conditions and their description of the other four application-specific wear mechanisms, which include material deposition, surface erosion, cavitation and electrical discharge.

You can connect and interact with other reliability and asset management professionals by joining the Asset Optimization, Maintenance and Reliability track in the Emerson Exchange 365 community.

Related Posts:

Detecting and Analyzing Impact Energy on Rotating Equipment

$
0
0

Let’s end this very busy week with a video which may be of interest if reliability and the management of plant assets falls within your set of responsibilities.

In this 3:45 YouTube video, Impact Analysis with PeakVue and Autocorrelation, Emerson’s Mark Granger demonstrates how to analyze impact energy on rotating equipment. Using a CSI 2140 portable vibration analyzer, Mark shows how the impacts he creates by tapping on the rotor assembly are immediately picked up by the PeakVue analysis.

The PeakVue peak-to-peak Gs waveform is autocorrelated to show whether an impact is from a periodic source such as bearings or gears, or from a more random source such as lubrication.

To connect and interact with other reliability and machinery management professionals, join and participate in the Asset Optimization, Maintenance and Reliability track of the Emerson Exchange 365 community.

Related Posts:

Detecting and Analyzing Mass Speed, Force, and Impact

$
0
0

 Business Development Manager

Mark Granger
Business Development Manager

When performing vibration measurements during route-based maintenance activities, different vibration measurements uncover different issues with plant machinery.

In this 4:20 YouTube video, PeakVue Analysis, Emerson’s Mark Granger demonstrates some of these differences in vibration analysis using a spring-mass assembly.

Mark connects a triaxial accelerometer or triax to the spring mass and shows the differences in vibration signals when views from the CSI 2140 portable vibration analyzer.

Mark oscillates the mass and records the vibration readings coming in from the triax to the CSI 2140. These readings include PeakVue, acceleration, and velocity. The velocity measurement displays the speed of the mass and is as expected—a sinusoidal waveform.

He next shows the acceleration plot. Acceleration refers to the force on the machine. The plot displays the sinusoidal wave with spikes superimposed. The spikes are caused by the spring rubbing against the mass during the oscillations.

The third property Mark showed is impact, which is the force that is being applied on a period or non-periodic basis. The PeakVue analysis detects impact by measuring G-force levels at over 100,000 vibration readings per second.

Mark then compares the PeakVue analysis with another signal processing technique called demodulation. Demodulation data will strip away the sinusoidal energy information, but it does not get the absolute accurate peak level of the impacts.

To connect and interact with other reliability professionals, visit and join the Asset Optimization, Maintenance and Reliability track in the Emerson Exchange 365 community.

Related Posts:

Early Detection of Impending Pump Failures

$
0
0

The post Early Detection of Impending Pump Failures appeared first on the Emerson Process Experts blog.

Even non-critical pumps in your process can cause spills, vapor clouds, fires and worse. Most of these failure incidents provide warning well in time to solve the problem—if feedback mechanisms are in place for your operators and maintenance personnel.

Emerson's Cranford Johnstone

Cranford Johnstone
Sales Manager – Reliability Solutions

TCEToday-Early-Detection-PumpIn tce, the online magazine of the Institution of Chemical Engineers, Emerson’s Cranford Johnstone authored an article, Early detection pays off.

He opens:

PETROCHEMICAL plants have a large number of pumps that are continually in use for functions that range from feedstock supply to product distribution. Pump repairs typically consume up to 7% of the total maintenance budget and therefore must be carefully considered within an overall maintenance programme.

He notes that typically less than 5% of the pumps—the most critical ones—are typically continuously monitored with machinery protection systems. And, of the conditions that can lead to pump failure, according to author Ron Moore:

…up to half of all failures are process induced and are therefore preventable.

Conditions causing pump failure include process operating conditions and mechanical wear. Cranford gives an operating condition example:

…when changes in operating conditions induce pump cavitation (a result of insufficient net positive suction head), this can grossly accelerate impeller wear and lead to seal failure.

Mechanical wear can manifest itself in several ways:

…imbalance, poor shaft alignment, loose pump mounts, broken bolts, foundation cracks, and damaged impellers. These defects gradually decrease the integrity of the machine and can lead to coupling, seal and bearing failures.

The traditional approach to inspecting the majority of pumps without online condition monitoring systems has been:

…by monitoring vibration, commonly by manual measurements on a periodic basis – typically every 30–90 days. Assuming that a trained analyst is available to review the data, these periodic checks can be used to detect many faults in advance; even then, however, they still leave the plant vulnerable to unplanned outages in between measurements.

What’s missing is real-time feedback with a clear indication of pumps in distress and the severity level of the fault. Cranford a way this feedback can be provided through monitoring raw vibration and high frequency impact faults. I highlighted the PeakVue Analysis diagnostics for these impact faults in a post, The Peaks Provide the Early Warning in Machinery Protection.

He describes how wireless technology has made collecting vibration and other data to gauge pump health more feasible:

For example, for a total picture of pump health we also need pressure monitoring to check for clogged suction strainers as well as pre-cavitation. If these values are not already being monitored, wireless pressure transmitters can be added easily and affordably.

Readings for vibration, impacting and pressure can all be broadcast over the same wireless network, and the system can be easily expanded to include temperature, level, flow and many other parameters. Users can monitor online for the conditions that are of greatest concern, including cavitation, bearing temperature, vibration, process leakage, suction strainer differential pressure, discharge pressure, seal reservoir level and pressure.

By providing early warning to failing pump health, safety, environmental, and production-related incidents can be avoided. Read the article for more on common threats to pump health, paying attention to the role of control valves, and how these technologies have been applied at the SABIC olefins plant in Teesside, UK.

You can also connect and interact with other reliability experts in the Reliability and Maintenance group in the Emerson Exchange 365 community.

Multi-parameter Condition Monitoring for Plant Asset Reliability

$
0
0

Across many process manufacturing and producing industries, falling prices are driving the need for increased efficiency and reliability, as well as reduced costs. While optimizing process control can yield gains, so can applying technology to the condition of the equipment involved in process operations.

Emerson's Jonas Berge


Multi-parameter-Condition-MonitoringIn a Control Engineering Asia article, Multi-parameter Condition Monitoring, Emerson’s Jonas Berge describes how adding measurements focused on equipment conditions allows reliability and maintenance teams and others in the plant to save time and benefit from improved plant maintainability.

Making this possible is the availability of:

…industrial information and communications technologies (IICT) such as bus, wireless, and cloud computing.

Jonas lists typical pieces of equipment that can lead to unplanned downtime and process slowdowns:

  • Pumps
  • Blowers
  • Cooling towers
  • Heat exchanger
  • Air cooled heat exchangers (ACHE)
  • Pipe & vessel corrosion
  • Valves

He describes the shortcomings in maintenance contracts for manual periodic data collection, rotating equipment vibration analysis, pump seal flush systems, etc. The lag between inspections may allow problems to develop and worsen. A better approach is to have:

…a data-driven approach to reliability and maintenance scheduling. Existing plants can be modernized to become smart plants.

For plant assets not already protected with continuous protection and prediction monitoring, the:

…wireless vibration transmitter is another way to monitor vibration on non-critical rotating equipment, serving as an intermediate tool to complement online machinery protection systems and portable vibration testers.

Many essential assets such as cooling tower fans, air-cooled heat exchangers, and blowers to name a few are not easily monitored due to safety concerns and access difficulty. For these applications, the:

…vibration sensors are mounted inside the enclosures and wired to the wireless transmitter outside the enclosure.

Instead of collecting data from manual rounds on a weekly, monthly or quarterly basis, more frequent [hyperlink added]:

data automatically monitored by software improves the data analysis to capture developing issues in the early stages rather than later, when damage or outright failure and shutdown have already occurred. More frequent and recent data makes the diagnostics more predictive, makes root-cause analysis easier, and also makes it possible to visualize degrading conditions by severity trend in software.

Jonas describes how diagnostics such as PeakVue Analysis, provide early warning to impending problems in time to take proactive actions to address the problem before a failure occurs.

He describes multi-parameter condition monitoring as being about:

…observing measurable properties for signs of internal fouling or faults. Additional sensors for equipment pressures, temperature, flow, auxiliary seal flush fluid levels, position, pH and conductivity provide data on operating process and ambient conditions that help in root-cause analysis. This allows other problems like fouling, scaling, and leaks etc. to be detected.

You’ll want to read the article for examples of how multi-condition monitoring is applied to air-cooled heat exchangers and pumps to improve overall reliability and efficiency of maintenance operations.

You can also connect and interact with other reliability and maintenance experts in the Reliability & Maintenance group in the Emerson Exchange 365 community.

The post Multi-parameter Condition Monitoring for Plant Asset Reliability appeared first on the Emerson Process Experts blog.

Avoiding Rotating Machinery Downtime with PeakVue Diagnostics

$
0
0

We all appreciate the diagnostics in our cars that provide early warning to get a problem fixed before a breakdown occurs. We’ve chronicled how rotating machinery diagnostics, such as PeakVue Analysis diagnostics, can provide early warning to avoid unplanned shutdowns.

Emerson's Jacob Swafford


Emerson’s Jacob Swafford shared several PeakVue examples with me. A North American cogeneration power company was alerted to a high 2x peak with harmonics on a boiler feed pump motor’s inboard bearing. As this peak level increased, a machinery vibration analyst identified the problem as looseness in the bearing housing causing the bearing case to turn with the motor shaft.

PeakVue-2x-peak

The repair could be scheduled instead of worsening to the point of failure and causing a loss of electrical power for their customers.

A second example Jacob shared was at a chemical manufacturing plant. An increase in vibration on a gearbox shaft outboard bearing was flagged for the watch list and data analysis was increased in frequency to once every other week. This gearbox was on a critical agitator that runs in a batch process.

The PeakVue Analysis diagnostic helped to identify a fundamental train frequency (FTF or cage frequency) defect. The amplitudes of this defect actually decreased as the Machinery Performance and Condition Monitoring Services team continued to monitor the situation, which is a good indicator of a bearing in its final stages of life.

Agitator-Gearbox-Vibration

The batch ran over the course of months so the machinery monitoring and analysis team was able to closely track the bearing to make sure it would last through the end of batch where a replacement could be planned and scheduled.

We’ll share some more stories in the coming months. Until then, you can connect and interact with other maintenance and reliability experts in the Reliability & Maintenance group in the Emerson Exchange 365 community.

The post Avoiding Rotating Machinery Downtime with PeakVue Diagnostics appeared first on the Emerson Process Experts blog.

Planning and Justifying the Industrial Internet of Things

$
0
0

One of the key ways to improve operational performance is to reduce unplanned downtime. An ARC Advisory Group blog post, Technology Trends to Watch for in 2017, noted:

One of the biggest end user challenges remains unscheduled downtime. IIoT-enabled solutions, such as remote monitoring and predictive maintenance, can help minimize, if not totally eliminate this, which would deliver a rapid ROI.

Emerson's Phil Niccolls


At the recent ARC Industry Forum, ARC’s Harry Forbes interviewed Emerson’s Phil Niccolls in this 8:10 YouTube video about the challenges manufacturers face in planning and justifying the use of Industrial Internet of Things (IIoT) in improving operational performance.

Phil opens noting three concern areas he often hears. The first is around needing help in assessing the technology available and the financial justification to go forward. The second area is security. As additional wireless measurement and access for remote experts to analyze and recommend, the need for a highly-secure infrastructure is required. The third area is to develop the project roadmap going forward—what should be done and in what order. This also includes determining the measures of success.

He explains that over $1 trillion dollars is lost by global manufacturers and producers due to suboptimal performance. Phil described how Emerson has taken a programmatic approach called Operational Certainty to help manufacturers achieve Top Quartile performance in their respective industry segment.

This approach consists of Plantweb digital ecosystem technology built on years of digital communications and wireless device and infrastructure experience. This experience helps to create the Secure First Mile to get data out securely to the analytics software and experts required to act up the information provided by these Pervasive Sensing devices around the manufacturing facility.

As an example, Phil cites PeakVue diagnostics which help predict when equipment failures will occur. For more on how this analytics-based diagnostic works, visit the post, Avoiding Bearing Failures with the Rule of Tens PeakVue Measurement Methodology.

Watch the video for more as Phil describes how these analytics are available at many levels and for many roles including locally on smart phones and tablets to remotely to remote experts via Connected Services.

You can also connect and interact with other IIoT and operational improvement experts in the Wireless and Improve & Modernize groups in the Emerson Exchange 365 community.

The post Planning and Justifying the Industrial Internet of Things appeared first on the Emerson Process Experts blog.


Mobile Device Task-Based Procedures for Vibration Analyzers

$
0
0

CSI-2140-Mobile-Procedures-QR-codeCSI-2140-Mobile-ProcedureThe growing impact of smart phones and tablet technology continue to impact our everyday lives, including our world of process automation. I heard from some friends on Emerson’s Machinery Health Management team of a new mobile site, the CSI 2140 Mobile Procedure. It provides maintenance personnel access to instructions for common vibration analysis tasks from a mobile device.

In an earlier post, Portable Vibration Analyzer-Human Centered Design Style, I shared some improvements in this device to increase the efficiency of route-based machinery vibration collection and analysis.

For this mobile site, instead of providing the entire product manual in a mobile web-based format, a human-centered design, task-based user interface is provided.

The site lists common tasks that are typically performed. Many tasks include the prerequisite steps required to perform the task, a step-by-step procedure to follow, and the results of the task that one should expect. Other tasks provide an overview of the task followed by a step-by-step procedure.

For example, the task to collect a vibration waveform provides this overview:

A vibration waveform is a graph that shows how the vibration level changes with time. The waveform shows the vibration level at a particular time during the measurement.

The waveforms are discrete graphs represented by a series of equally-spaced, discrete sample points (connected by straight lines). The more sample points in a spectrum, the higher the resolution of the waveform and the more memory used.

Here is the step-by-step procedure:

  1. Create a job or open Analyze from a route measurement point.
  2. From the Analyze main menu, press F1 Manual Analyze > F1 Set Analyze Mode.
    Use the up and down arrow keys to select Waveform.
  3. Press Enter. The Analyze Setup screen appears.
  4. Set the following options as necessary.
    Option Description
    F2 Set Fmax Set the maximum frequency for the waveform.
    F2 Set Sample Rate Enter a value between 25.6 and 204,800 for the number of samples per second. The default is 1,024.
    F4 Set Samples Enter a value between 256 and 32,768 for the number of samples to collect. The resolution of the waveform increases with the number of samples used. The more samples, the more information the waveform contains. The default is 1,024.
    F5 Set Sample Time Enter the total time that data is collected for each waveform. The duration of a waveform is the total time information is collected from the waveform. The default is 1. Note: Enter either the sample time or the number of samples. Setting one adjusts the other automatically.
    F7 Tach Setup Set up the tachometer parameters. See Set up a tachometer.
    F8 PeakVue Demod Enable or disable PeakVue or Demodulation. See PeakVue and demodulation.
    F9 Set Trigger Select the type of trigger to use to start the measurement. See Triggers.
    F12 Input Setup Set up the input channels, the sensor type, and the units for the acquisition type.
  5. Press Enter to collect the data. One or more plots display the data.
  6. Press F9 Store Data to save the data to a route or a job, or press F8 Start to redo the measurement.

The Machinery Health team invites your feedback on this application to continue to refine and make it more valuable for maintenance professionals.

Give it a try and see what you think.

You can also connect and interact with other machinery health professionals in the Asset Optimization, Maintenance and Reliability track of the Emerson Exchange 365 community.

The post Mobile Device Task-Based Procedures for Vibration Analyzers appeared first on the Emerson Automation Experts blog.

Avoiding Bearing Failures with the Rule of Tens PeakVue Measurement Methodology

$
0
0

Few things wreck a good day at the plant, mill, platform, wellpad, or other process like a bearing failure on an important pump, compressor, fan, or other piece of rotating machinery. Identifying the problem early before it leads to an unplanned shutdown means the work to fix it can be scheduled to minimize operational impacts.

In earlier posts, such as Spotting Bearing Failure in Time before Complete Fan Failure, we highlighted the unique PeakVue (peak value analysis) methodology to detect early problems with bearings before they lead to a bad day. This diagnostic tool is useful for bearing defect detection in applications where normal spectral analysis has proven to be ineffective—large gearboxes, slow speed machinery, etc.

Through the magic of a succinct, 3-minute YouTube video, PeakVue InfoGraphic Animation, here is an overview explaining PeakVue measurements of stress waves on a typical plant asset through the stages of bearing failure.

Rule-of-10sBearings with no problems should have a PeakVue value close to 0. The video shares a simple “rule of 10’s” guideline that highlights the stages of bearing failure—onset of problems (10g’s), serious problem (20g’s), critical problem (40g’s). This progression may occur over weeks or even months, but once it advances past 40g’s, a failure is likely to be imminent.

This PeakVue measurement is available in the vibration analysis products including the CSI 2140 portable analyzer, the CSI 9420 wireless vibration transmitter, and the CSI 6500 machinery health monitor.

You can connect and interact with other reliability and machinery health professionals by joining in the Asset Optimization, Maintenance and Reliability track of the Emerson Exchange 365 community.

The post Avoiding Bearing Failures with the Rule of Tens PeakVue Measurement Methodology appeared first on the Emerson Automation Experts blog.

Rotating Equipment Bearings and Potholes

$
0
0

Concerning yesterday’s post, Avoiding Bearing Failures with the Rule of Tens PeakVue Measurement Methodology, I received an email with a great analogy about pits in ball bearings and potholes.

Potholes in the road – https://en.wikipedia.org/wiki/Pothole

Driving your car on a freshly paved circular track is like a PeakVue measurement at or close to 0g on the bearings of your rotating machinery.

As a pothole begins to form and you drive over it, you hear and feel a little bump on each trip around the track. That’s like a PeakVue measurement of 10g’s indicating an early onset of problems with the pump, compressor, fan, or other piece of rotating equipment.

When the pothole has grown larger and you drive over it each time, you hear a feel a loud bump and worry that your tire is damaged and your car in need of an alignment. That’s like a PeakVue measurement of 20g’s indicating a serious problem.

When you drive over a pothole so large, that your tire bursts, the car bottoms out, and you see a trail of oil in your rear view mirror. That’s like a PeakVue measurement great than 40g’s and your plant asset is in critical condition. It may not have completely broken down, but the breakdown is imminent.

Watch out for those potholes, monitor those bearings, and take care of them early when the reading climbs up to the 10g range.

The post Rotating Equipment Bearings and Potholes appeared first on the Emerson Automation Experts blog.

What is Damaging Your Plant Machinery?

$
0
0

Ray Garvey Application Engineer

Ray Garvey
Application Engineer

“Why do some machines fail early, while others operate for many additional years?” Emerson’s Ray Garvey and Spectro‘s Pat Henning open with this great question in a Machinery Lubrication article, Identifying Root Causes of Machinery Damage with Condition Monitoring.

Machinery-Lubrication-Condition-MonitoringRay and Pat point to eight sources that can damage your plant’s machinery including:

…abrasion, corrosion, fatigue, boundary lubrication, deposition, erosion, cavitation and electrical discharge.

The good news is that condition monitoring can detect each of these life-shortening conditions to provide your maintenance team early warning to take corrective actions.

The authors note that four of these conditions, abrasion, corrosion, fatigue and boundary lubrication provide the majority root cause of plant asset failures. Abrasion:

…is usually a result of three-body cutting wear caused by dust contamination of the lubricating oil compartment. Dust, which is much harder than steel, gets trapped at a nip point between two moving surfaces. The trapped particles tend to imbed in the relatively softer metal and then cut grooves in the harder metal.

Stress waves are produced in the metal which can be detected [hyperlink added]:

…using high-frequency stress-wave analysis techniques such as Emerson’s PeakVue™ technology.

They highlight the importance of establishing lubrication cleanliness targets as outline in ASTM D7416, D7647 and D7596.

Corrosion:

…is a chemical reaction that is accelerated by temperature. The Arrhenius rate rule suggests that chemical reaction rates double with each increase in temperature of 10 degrees C.

It is best detected:

…using spectrometric oil analysis (SOA) such as rotrode (ASTM D6595).

Fatigue:

…is a consequence of subsurface cracking, which is caused by cumulative rolling contact loading of rollers, races and pitch lines of gear teeth… Eventually, the metallic hardening progresses to subsurface cracks accompanied by acoustic emissions like miniature earthquakes.

Ray and Pat share fatigue detection methods:

Acoustic emission or stress-wave analysis such as PeakVue is capable of detecting subsurface cracking that eventually produces fatigue wear. X-ray fluorescence spectroscopy (XRF) and ferrous density measurements are used to detect wear debris released into a lubricant….v

They point to the ASTM D7596 standard as a good approach for the particle analysis.

The fourth major root cause, boundary lubrication or adhesion:

…is a lubrication regime in which loads are transferred by metal-to-metal contact. For most machine designs, this is abnormal because preferred lubrication methods provide a lubricant film between load-bearing surfaces.

When the proper lubrication breaks down metal-to-metal contact occurs between the moving surfaces increasing friction levels. Condition monitoring to detect this condition include:

Contact ultrasonic measurements or high-frequency stress-wave analysis techniques such as PeakVue are capable of detecting friction produced by boundary lubrication (metal-to-metal contact). Oil-breakdown-related techniques such as viscometry, time-resolved dielectric (ASTM D7416), AN and BN are also relevant in this case.

You’ll want to read the article for a more detailed look at these conditions and their description of the other four application-specific wear mechanisms, which include material deposition, surface erosion, cavitation and electrical discharge.

You can connect and interact with other reliability and asset management professionals by joining the Asset Optimization, Maintenance and Reliability track in the Emerson Exchange 365 community.

The post What is Damaging Your Plant Machinery? appeared first on the Emerson Automation Experts blog.

Detecting and Analyzing Impact Energy on Rotating Equipment

$
0
0

Let’s end this very busy week with a video which may be of interest if reliability and the management of plant assets falls within your set of responsibilities.

In this 3:45 YouTube video, Impact Analysis with PeakVue and Autocorrelation, Emerson’s Mark Granger demonstrates how to analyze impact energy on rotating equipment. Using a CSI 2140 portable vibration analyzer, Mark shows how the impacts he creates by tapping on the rotor assembly are immediately picked up by the PeakVue analysis.

The PeakVue peak-to-peak Gs waveform is autocorrelated to show whether an impact is from a periodic source such as bearings or gears, or from a more random source such as lubrication.

To connect and interact with other reliability and machinery management professionals, join and participate in the Asset Optimization, Maintenance and Reliability track of the Emerson Exchange 365 community.

The post Detecting and Analyzing Impact Energy on Rotating Equipment appeared first on the Emerson Automation Experts blog.

Viewing all 57 articles
Browse latest View live